


Have you heard of Flowboost Labelizer? Here's a quick overview of how you can double your ROI on your Performance Max campaigns in Google Ads.
Content
Introduction of Flowboost Labelizer Script
How to Make the Most of This Information?
Introduction
Efficiency and automation - these are two key factors that influence the success of advertising campaigns in the world of digital marketing today. There are a plethora of tools that can help you with these two elements. However, for now, we'll focus on just one of them.
Flowboost Labelizer is a script that is designed to improve the management and analysis of your advertising campaigns and offers innovative ways to automate the processes involved in labeling and segmenting your products.
Introduction of Flowboost Labelizer Script
Main Features
The main function of this script is to automatically label products in Performance Max campaigns based on predefined criteria. These criteria include:
- The number of impressions
- The number of clicks
- Spend
- Return on investment
- Conversion rate
When implementing the script, it is therefore important that all variables are set in accordance with your requirements to avoid distortion of the data obtained. All the instructions and recommendations on how to set these values are available directly in the script itself. However, not everything always works as we imagine, so it is necessary to test different variations of values to find the best possible combination.
It is also important to mention that for each account, the default settings may look different. It all depends on the industry you're in, the type of products and most importantly what you expect from the script.
In our particular case, the defaults looked like this:
.png?width=602&height=57&name=pasted%20image%200%20(9).png)
The numbers shown in green in the picture are important - they need to be set well for the script to work properly. These are the values you will find in your Google Ads account at the campaign level:
- Breakeven return on investment (breakeven ROAS)
- Average Conversion Rate (AverageCvr)
- Impression Threshold (impressionThreshold)
- Number of days you want to collect data (daysAgo)
How the Script Works
Flowboost Labelizer works by directly interacting with data from your Google Ads account. It analyzes the available information and sorts products into five preset categories based on the criteria mentioned above:
- Over-index - This category includes any products that perform significantly better than what their actual target is and have a sufficient number of clicks according to a click multiplier that you can set yourself.
- Index - If a product is categorized as 'index' in the 'custom label 1' column, it means that it is performing at or slightly above the target and has achieved enough clicks for at least one conversion.
- Near-index - This category tells us that the product is performing slightly below target. However, it is usually the second largest group that delivers the most value in absolute terms.
- Under-index - In this category you will find products that are below the target performance level. They usually have more than one conversion as well as enough clicks, but their ROAS does not meet the conditions of the above categories.
- No-index - If a product doesn't meet any of the above conditions, it is labeled as "no-index". This usually means it has a very low number of conversions and clicks. However, it may contain a relatively large number of items.
The result of this analysis is then a spreadsheet that gives you a more detailed insight into your Performance Max campaigns, which you can then use to take appropriate action. For example, you can see which product categories are just spending your budget without the desired results, and which are delivering the desired returns.
.png?width=602&height=90&name=pasted%20image%200%20(10).png)
Source: Forecom internal data
As you can see, the 'near-index' category brings the most profit, which in our experience is the most common scenario.
Interpretation of Results
Now that we have explained how the products are categorised, we can turn our attention to interpreting the data. The final data and results that the script produces are available in very clear pie and bar charts directly in Google Sheets. You can find a link to them in the script itself.
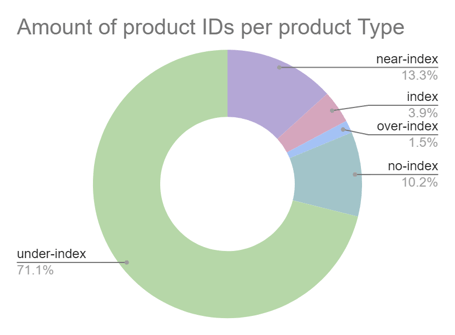
The first of the pie charts provides information regarding the amount of products in each category:
Source: Forecom internal data
As you can see, the most represented category are those products that do NOT deliver the desired results, i.e. under-index and no-index, but this is not uncommon, so nothing to worry about. Generally we call this category 'underperforming products' or if you prefer 'underperforming products'.
The second of the pie charts is, in our opinion, the most important and interesting. It provides information regarding the revenue from each category:
.png?width=454&height=335&name=imageLikeEmbed%20(1).png)
Source: Forecom internal data
The highest revenues are generated by the 'performance products' category, which includes over-index products, index products and near-index products. However, only about 20% of the total are products, confirming the well-known Pareto principle that 80% of the effects stem from 20% of the causes. So with this chart and the preset filter (pictured below) in the second tab of the tables, you are able to see which products are the most profitable for you.
.png?width=602&height=369&name=pasted%20image%200%20(11).png)
Source: Forecom internal data
The third chart, also very interesting, is a pie chart that shows the cost of each product category:
.png?width=454&height=335&name=imageLikeEmbed%20(2).png)
Source: Forecom internal data
In our case, the costs are almost evenly distributed in 4 of the 5 categories. The last category, no-index products, consumes only up to 1% of the total budget, because these products are hardly displayed and users simply do not click on them. Maybe this is new to you and especially annoying information. No one wants to have products in their portfolio that have almost no interest. On the other hand, this is why it's a good idea to apply the Flowboost script to your Google Ads account, so that you can take measures (explained below) to ensure that these products also get their own space in your adverts.
The last graph you get with the script is a bar chart that interprets the information regarding the profitability of all categories:
.png?width=454&height=335&name=imageLikeEmbed%20(3).png)
Source: Forecom internal data
As you can see, the most lossy category is products that fall into the under-index group. Conversely, the most profitable category is near-index products. The goal of applying the script is to make the last two columns bridge over 0 and the first three columns climb as high as possible.
Note: The results may look different for each account, but it is generally known that approximately 20-30% of products will bring you 70-80% of the profits.
How to Make the Most of This Information?
In the first part of our overview, we explained what data and information you can get from a script, but now we will focus on the most important things. You may be thinking that it's useful to know which product is getting you what results, but what do you do with this data?
It's simple, if we are able to segment products by their performance, we are also able to tailor any marketing campaigns to what we intend to do with that product category. Whether it's optimizing the number of conversions, adjusting bidding strategies, allocating budgets or just adjusting the number of impressions and clicks, the script simply opens the door to a variety of opportunities.
The best thing you can do at any given time is to divide your Performance Max campaigns by the aforementioned categories and then adjust the settings of each campaign specifically as needed. Keep in mind, however, that less is sometimes more, and we've also found it most effective so far to split an existing Pmax campaign into just two others:
- Pmax - high performing products (over-index, near-index and index)
- Pmax - non-performing products - (under-index and no-index)
The aim of this division was to get the highest possible profit from the high-performance products, mainly by not being constrained by the low-performance ones. This primarily translates to them getting more impressions than if all products were together in one campaign.
For campaigns with underperforming products, on the other hand, we aimed for them to start generating the desired profit.
Note: We achieved the best results with a 65:35 budget split for the 'Pmax - high performing products' campaign.
Final Results
Below are the results focused on the Pmax campaign only. Only one Performance Max campaign (without Flowboost Labelizer script) with all products combined was active in the tested account between 1.8.2023 and 30.8.2023. Then from 1.11.2023 to 30.11.2023, after a period of testing and trying different combinations, this campaign was split into two Pmax campaigns (see above).
|
|
ROAS |
Conversion value |
Conversion |
Price |
CPC |
Interaction rate |
Price/covers |
|
1.8.2023 - 30.8.2023 |
6,63 |
$19 764,5 |
296 |
$2 980 |
$0,72 |
0,84% |
$10,06 |
|
1.11.2023 - 30.11.2023 |
15,19 |
$37 075 |
441 |
$2 442 |
$0,65 |
2,18% |
$5,53 |
|
Rozdíl |
128,93% |
87,58% |
49,07% |
-18,06% |
-9,22% |
158,42% |
-45,03% |
Source: Forecom internal data
The results for the tested account indicate that there was a significant improvement in all metrics monitored. However, if you are going to implement the script in your account, be cautious, as it may not always have a positive result. Additionally, as the script's creators themselves claim, it is not advisable to apply the script to campaigns that have not received at least 50 purchases in the last 30 days, so if you don't meet this number, it's best to keep your existing campaign structure. If you're unsure about implementing the script, feel free to contact us. We will be happy to answer any questions you may have and try to help you as much as possible.
Note: If you decide to implement the script, start slowly. Only split the original campaign into two (like we did in the article) and then experiment with further segmentation.
Conclusion
Our study of the Flowboost Labelizer script shows that this script can be a great asset for effective ad campaign management. Its automated product segmentation can save you a lot of time, plus you can achieve generally better performance on individual campaigns. However, its implementation and subsequent restructuring of campaigns may not always lead to positive results, so be careful with its use.

.svg)

.svg)